


The NCAA tournament needs more objectivity
Don't let great teams fall through the cracks
The men’s and women’s NCAA tournament fields will be announced this weekend. If you don’t follow college basketball as obsessively as I do, you might be surprised by how labor-intensive and subjective the selection process is. A 12-person committee meets for five straight days to pick and bracket the field, following a several-page process across dozens of rounds of voting.
Lots of data is put in front of the committee, but that doesn’t make the process objective:
The top of the page shows several different ranking systems—some based on the team's “resume” (their wins and losses, weighed by how good the opponents were), some that are "predictive" (not just wins and losses but how much they won by), and the NET (the NCAA's own metric that kind of blends both, but not very well). Each of these metrics is objective, but using them together is subjective: what should you do if a team is better in one or worse in the others?
Most of the page—and, anecdotally, most of the discussion—is organized around “quadrants” (every game grouped by how good the opponents were, adjusted for home-court advantage). This is also objective data, but it’s even more subjective: how do you judge a team who’s better in one quadrant and worse in another? And what if the teams have very different sample sizes in each quadrant?
Committee members are also encouraged to use whatever other information they want, including subjective stuff like watching games, adjusting for key players’ absences, etc.
It's impossible to rank college teams purely by wins and losses like pro leagues do—with 362 teams and only 30ish games in a season, everyone plays a wildly different schedule. But with the analytics available today, we don't have to settle for 12 people making decisions in a room; the NCAA’s hockey tournament, for instance, is picked entirely by formula. We should strive to do the same for basketball.
One metric to rule them all
For an objective system to work, it should:
Closely match what the committee has done in the past, so it has credibility
Be simple, so everyone can understand it
Account for the full schedule, so every game matters
There’s already a framework for doing exactly this—the Easy Bubble Solver, invented by Drew Cannon more than a decade ago. It goes like this: Take one “resume” metric and one “predictive” metric, average them together, and rank all the teams by that average. That’s it!
(For this post, I’ll use Wins Above Bubble as the resume metric and T-Rank as the predictive metric because there’s already an easy way to analyze it, but the results are similar with any other combinations. And I'll focus on the men's tournament because that's where better data is available, but everything applies to the women's field too.)
This simple metric closely matches what the committee does. Compared to the consensus forecast (which usually does a really good job of predicting the committee's bracket), this year EBS would select the exact same top 16 teams to be 1-4 seeds, and as of Friday when I’m writing this, it picked 35 of the same 36 at-large teams. (Sunday update: after a lot of chaos yesterday, nobody really knows who’s going to be selected now, which is unusual.)
That's not an aberration: for each of the prior three tournaments, the EBS would have picked all but two or three of the same teams as the committee did.1 Half of the teams it picks differently were in the committee's first four in or out, the range where they could have easily gone either way. And there's no obvious pattern to the teams that get left in or out; EBS picks roughly the same balance of power-conference teams and others as the committee does, so nobody has a big reason to complain.
None of this is a coincidence, because EBS is doing the same thing the committee does: pick the most deserving teams, by assessing resumes and team quality. It's just doing it more rigorously.
Avoiding subjective mistakes
If all we're doing is approximately replicating the committee’s process, what's the point? It would save a dozen people lots of time picking the field—and hundreds of bracketologists even more time predicting it—but that’s not my time, so I don’t care. The main reason: by using a metric that does the same thing, we can avoid mistakes—where a team that should make it by the committee’s established patterns is left out, without a compelling reason.
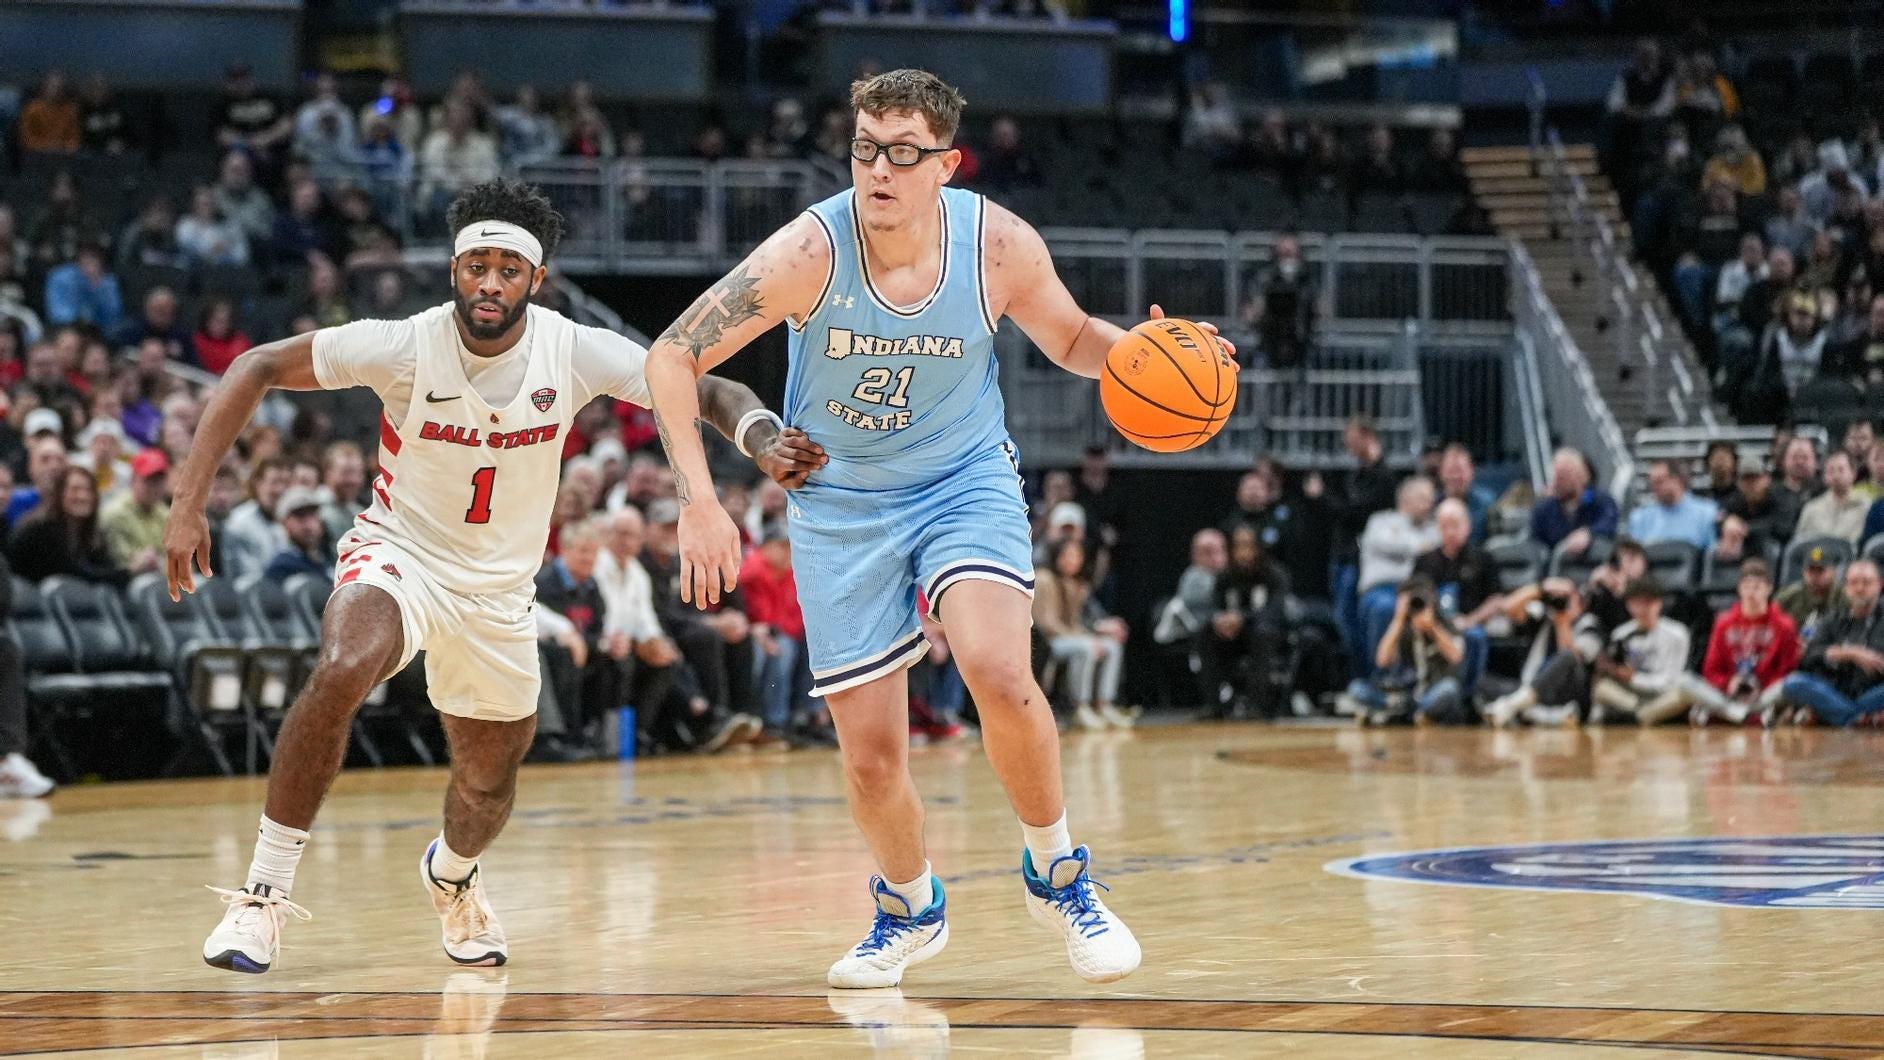
For example, Indiana State is 26th by EBS—easily good enough to be one of 36 at-large teams—because they rate really well on each of the resume and quality metrics. But they went 1-4 in “Quad 1” games, and even the one win there wasn’t sexy. Because selection discussion focuses so much on Quad 1 games, there’s a good chance they’ll be left out this year. If you instead started with their very strong EBS, and then gave them a penalty for underperforming in big games, I don’t think that would outweigh everything else in their favor (26-2 in all other games, far better than you’d expect from even a tournament-caliber team, and most agree they look the part).
I’d love to see the field selected entirely by EBS. In reality, to have any hope of getting buy-in, you’d need to keep a subjective layer for the committee can adjust for big wins, head-to-head wins, injuries, or whatever else it wants. But if that happened after using EBS as a baseline, it would be an improvement—not only would we have more transparency as to what explained each team’s selection, it’s also unlikely that the adjustments would be big enough to knock out Indiana State-like teams that clearly pass the bar on the objective metric.
2023 differences: North Texas and Oklahoma State in; Mississippi State and Nevada out
2022: Wake Forest, Oklahoma, SMU in; Seton Hall, Wyoming, Marquette out
2021: Arizona, Memphis, Penn State in; Wichita State, Utah State, Drake out